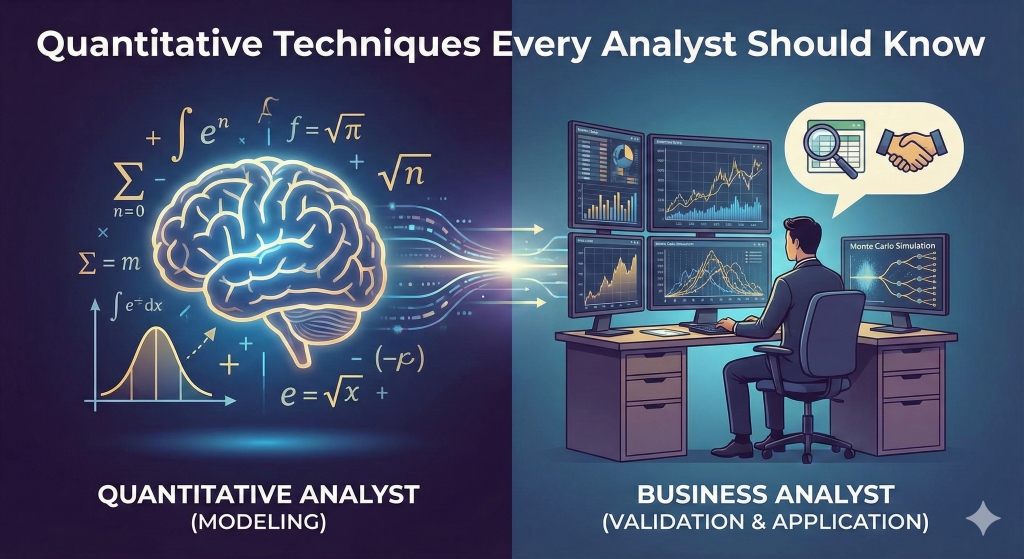


In the high-stakes world of capital markets, the line between a "Business Analyst" and a "Quantitative Analyst" is becoming increasingly porous. While you may not be the one writing the stochastic calculus code to price an exotic derivative, as a Business Analyst (BA), you are almost certainly the one who must define the requirements for that system, validate its outputs, or explain its "black box" logic to a stakeholder who just wants to know why their P&L looks wrong.
To thrive in this environment, you don't need a PhD in physics, but you do need a working fluency in the quantitative dialects spoken on the trading floor. This guide covers the essential quantitative techniques that every Capital Markets BA should master—not just to calculate, but to understand, critique, and leverage.
If there is one number that rules the risk department, it is Value at Risk (VaR). It is the standard metric for answering the question: "How much could we lose in a really bad day?"
VaR attempts to provide a single number that summarizes the total risk of a portfolio. It is defined by three components:
Example: A "1-day 99% VaR of $1 million" means that on any given day, there is a 99% chance that the portfolio will not lose more than $1 million. Conversely, there is a 1% chance (a "breach") that losses will exceed $1 million.
You typically won't calculate VaR by hand, but you will likely be involved in Model Validation or System Implementation for risk engines. You need to know the three main ways VaR is calculated to write accurate functional specifications:
When a problem is too complex to solve with a simple formula—like pricing an option whose value depends on the path of a stock price over time—quants use Monte Carlo simulations.
Imagine rolling a die 10,000 times to determine the probability of rolling a six. Monte Carlo simulations do this computationally. They use random number generators to simulate thousands of possible "future paths" for an asset price. By averaging the payoffs of all these paths, you arrive at a "fair price" today.
Financial data is almost always "time series" data—a sequence of data points indexed in time order (e.g., a stock price every minute, a GDP print every quarter).
When building trading dashboards or reporting tools, you need to understand Stationarity. Most statistical models break if the data's mean or variance changes over time (which financial data constantly does). A key requirement for any forecasting tool you specify is that it must be able to handle "shocks" and non-stationary data without producing garbage output.
Regression tells you how one variable affects another. In finance, this is the bedrock of Alpha and Beta.
You will often see this in Performance Attribution systems. When a portfolio manager asks, "Why did I underperform the benchmark?", the answer usually comes from a regression-based factor model. Your role is often to trace the Data Lineage: if the regression says the portfolio had high exposure to "Oil Price Risk," you need to be able to dig into the data and verify which trades caused that exposure.
This is where the Business Analyst shines. "Model Validation" is the process of proving a quantitative model works as intended.
A BA is often the "sanity check" defense line. If a model says a Treasury Bond has a 50% chance of default, the Quant knows the math, but the BA knows the market and can flag that result as impossible.
International Institute of Business Analysis
· IIBA
BA Blocks
Industry Certification Programs:
CFA(Chartered Financial Analyst)
FRM(Financial Risk Manager)
CAIA(Chartered Alternative Investment Analyst)
CMT(Chartered Market Technician)
PRM(Professional Risk Manager)
CQF(Certificate in Quantitative Finance)
Canadian Securities Institute (CSI)
Quant University LLC
· MachineLearning & AI Risk Certificate Program
ProminentIndustry Software Provider Training:
· SimCorp
· Charles River’sEducational Services
Continuing Education Providers:
University of Toronto School of Continuing Studies
TorontoMetropolitan University - The Chang School of Continuing Education
HarvardUniversity Online Courses
Study of Art and its Markets:
Knowledge of Alternative Investment-Art
Disclaimer: This blog is for educational and informational purposes only and should not be construed as financial advice.