In the high-stakes world of Capital Markets, an Order Management System (OMS) is more than just a software utility; it is the central nervous system of the trading desk. For Business Analysts (BAs) in this space, "performance" is a bifurcated concept. It isn’t just about whether the server is up (IT performance); it is about whether the system enables the trader to capture alpha (Business performance).
When an OMS lags, liquidity is missed. When an order routes inefficiently, slippage eats into P&L. For the Business Analyst, the challenge lies in translating these technical events into business-centric metrics.
This guide outlines the critical metrics every Capital Markets BA should track to build high-impact, analyst-centric OMS dashboards.
Part 1: The "Trader’s Pulse" – Execution Quality Metrics
The first layer of your dashboard must speak the language of the Front Office. Traders care about speed, certainty, and price. Your metrics here must answer the question: "Is the OMS helping or hurting my trade?"
1. Alpha Decay (Latency-Induced Slippage)
While IT tracks "latency" in milliseconds, BAs must track "Alpha Decay." This metric correlates internal system processing time with price movement.
- The Metric: $\text{Price Change during Internal Hold Time}$
- How to Track: Timestamp the order arrival at the OMS gateway ($T_{in}$) and the order release to the venue/broker ($T_{out}$). Capture the market bid/ask at both $T_{in}$ and $T_{out}$.
- The Insight: If the market consistently moves against the order between $T_{in}$ and $T_{out}$, your OMS latency is costing the firm money. This is a critical metric for justifying hardware upgrades or code refactoring.
2. Fill Rate Efficiency vs. Market Volume
A raw "Fill Rate" is useless without context. A 100% fill rate on an illiquid stock is suspicious; a 50% fill rate during a liquidity crunch might be excellent.
- The Metric: $\frac{\text{Order Fill Volume}}{\text{Market Volume during Order Lifecycle}}$ (Participation Rate)
- The Dashboard Visual: A scatter plot comparing your Participation Rate against the venue’s total volume. Outliers indicate where the OMS Smart Order Router (SOR) might be overly aggressive (signaling impact cost) or too passive (opportunity cost).
3. Order Rejection Analysis (The "Why" Pie Chart)
Rejections are the silent killers of trading momentum.
- The Metric: Rejection Rate segmented by Source (Internal Risk Check vs. Venue Rejection) and Reason Code.
- The Insight:
- High Internal Rejections: Your pre-trade risk limits might be too tight or data reference issues are blocking valid trades (e.g., missing ISINs).
- High Venue Rejections: Connectivity issues or protocol mismatches (FIX tag errors).
Part 2: The "Engine Room" – Technical Health with Business Context
IT monitors look at CPU and Memory. The Business Analyst’s dashboard looks at Throughput and Stability in the context of market events.
4. Peak Throughput Capacity (The "Market Open" Stress Test)
Systems often fail not during the day, but at the Open (9:30 AM EST) and Close (3:55 PM EST).
- The Metric: Orders Per Second (OPS) vs. System Latency.
- The Dashboard Visual: A dual-axis line chart. The Left Axis is OPS; the Right Axis is Latency (ms).
- The Warning Sign: If Latency spikes non-linearly as OPS increases (the "Hockey Stick" curve), your OMS has a scalability bottleneck that threatens stability during high-volatility events like Non-Farm Payrolls.
5. FIX Session Stability Index
The Financial Information eXchange (FIX) protocol is the lifeline to the outside world. A "connected" status is not enough.
- The Metric: $\text{Heartbeat Misses} + \text{Sequence Number Resets}$
- The Insight: Frequent sequence number resets or "Test Request" loops indicate an unstable connection that is prone to dropping orders during high traffic. This is a leading indicator of a future outage.
6. Message-to-Trade Ratio (The "Noise" Metric)
How much "chatter" does your system produce to execute one trade?
- The Metric: $\frac{\text{Total FIX Messages (New + Cancel + Replace)}}{\text{Executed Trades}}$
- The Insight: A skyrocketing ratio (e.g., 500 messages for 1 execution) suggests inefficient algo logic—such as an algorithm that "flickers" quotes without intent to trade. This can get your firm fined by exchanges for excessive messaging.
Part 3: Operational Efficiency – The Post-Trade Handshake
The trade is done, but the lifecycle isn't. The OMS must feed the PMS (Portfolio Management System), Risk, and Settlement systems.
7. STP (Straight-Through Processing) Rate
This is the holy grail of Operations.
- The Metric: Percentage of trades that flow from Execution to Booking without manual intervention.
- The Drill-Down: Track the "Touch Count"—the number of times a human has to manually amend a trade ticket in the OMS.
- The Cost: Every manual touch is a risk of fat-finger error and a delay in T+1 settlement.
8. Allocation Discrepancy Frequency
- The Metric: Number of trades where $\text{Executed Quantity} \neq \text{Allocated Quantity}$.
- The Insight: These discrepancies usually point to static data failures (e.g., a fund account not set up in the OMS) or comms failures between the Front and Middle office.
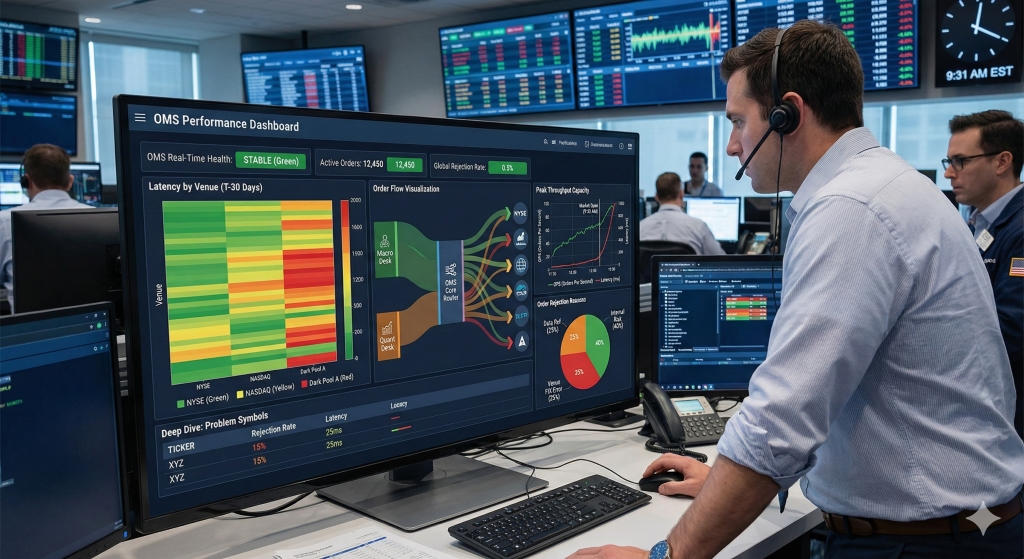
Part 4: Designing the Analyst-Centric Dashboard
A dashboard is only useful if it drives action. Avoid "watermelon metrics" (Green on the outside, Red on the inside).
Recommended Visual Hierarchy:
- Top Ribbon (Real-Time Health):
- System Status (Green/Amber/Red)
- Active Orders Count
- Notional Value Working ($)
- Global Rejection Rate (Today)
- Middle Tier (Trend Analysis - T-30 Days):
- Heatmap: Latency by Venue (e.g., NYSE vs. NASDAQ vs. Dark Pools). This highlights if one specific connection is dragging down performance.
- Sankey Diagram: Order Flow visualization. Show orders originating from specific Desks/Traders $\to$ OMS $\to$ Smart Order Router $\to$ Venues. This visually identifies bottlenecks.
- Bottom Tier (Deep Dive Table):
- Top 10 "Problem Symbols" (highest rejection or latency rates).
- Algo Performance ranking (VWAP vs. TWAP vs. Arrival Price).
The "3-Click" Rule
An analyst should be able to go from a Red Warning Light (Click 1) to the Specific Asset Class/Desk causing the issue (Click 2) to the Individual FIX Message Logs (Click 3) within 10 seconds.
Industry Links for Further Learning
To deepen your understanding of OMS performance standards and industry benchmarks, we recommend the following resources:
- FIX Trading Community: The official body for the FIX protocol. Essential for understanding tag-value pairs and session layer metrics.
- STAC Research (Securities Technology Analysis Center): The industry standard for high-performance computing benchmarks in finance. They provide detailed reports on latency and throughput testing.
- The Trade News: A leading publication covering the buy-side and sell-side technology landscape, often featuring case studies on OMS implementations.
- WatersTechnology: A premier resource for financial technology news, offering deep dives into how major banks and hedge funds structure their trading desks.
BA Blocks
· BA Blocks
· BA Block YouTube Channel
Industry Certification Programs:
CFA(Chartered Financial Analyst)
FRM(Financial Risk Manager)
CAIA(Chartered Alternative Investment Analyst)
CMT(Chartered Market Technician)
PRM(Professional Risk Manager)
CQF(Certificate in Quantitative Finance)
Canadian Securities Institute (CSI)
Quant University LLC
· MachineLearning & AI Risk Certificate Program
ProminentIndustry Software Provider Training:
· SimCorp
· Charles River’sEducational Services
Continuing Education Providers:
University of Toronto School of Continuing Studies
TorontoMetropolitan University - The Chang School of Continuing Education
HarvardUniversity Online Courses
Study of Art and its Markets:
Knowledge of Alternative Investment-Art
· Sotheby'sInstitute of Art
Disclaimer: This blog is for educational and informational purposes only and should not be construed as financial advice.