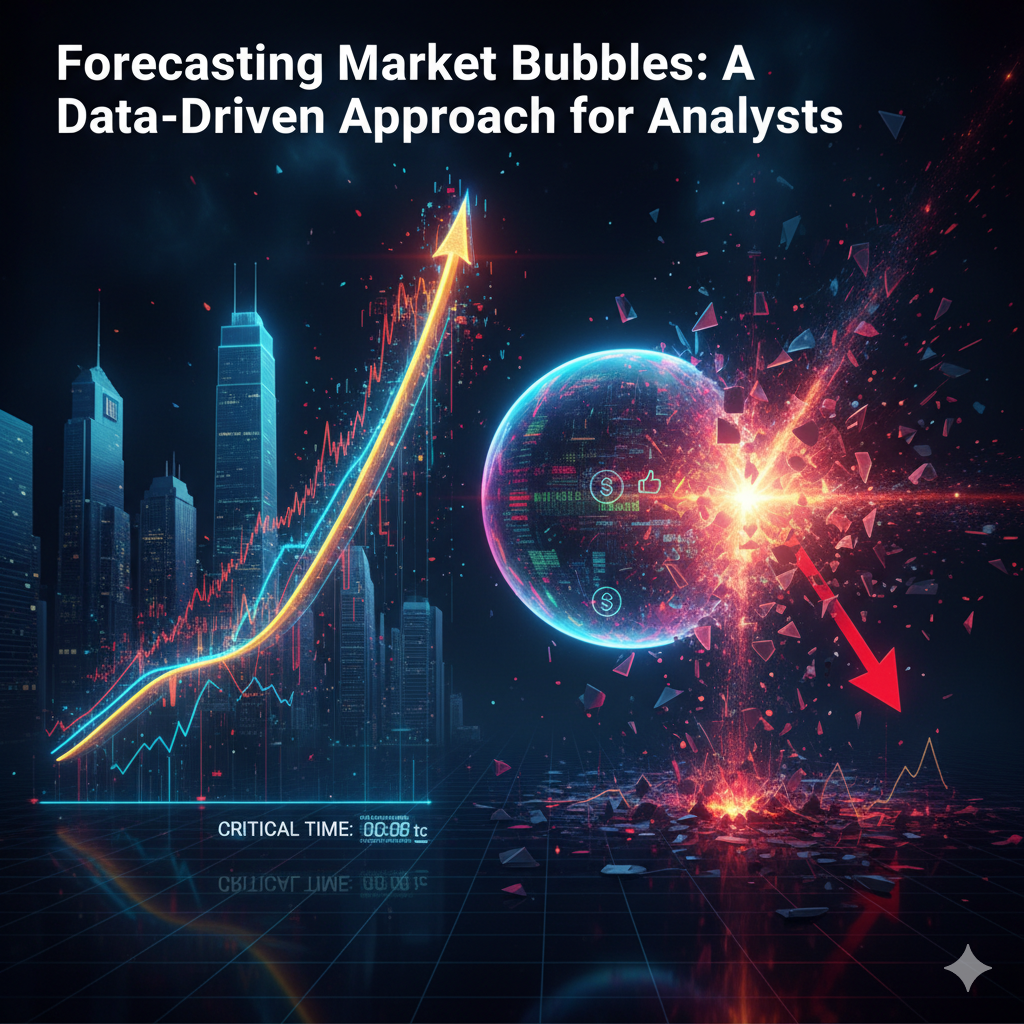


In the high-stakes arena of capital markets, the ability to distinguish between a robust bull market and a speculative bubble is perhaps the most coveted skill in an analyst's arsenal. For Business Analysts (BAs) and data strategists, this is not merely a philosophical exercise; it is a data engineering challenge.
Historically, bubble detection was the domain of "gut feeling" macro economists. Today, it is a computational discipline. By combining traditional valuation metrics with behavioral finance signals and advanced mathematical modeling (such as LPPLS), analysts can build early warning systems that quantify exuberance before the inevitable correction.
This guide outlines a multi-layered data strategy for forecasting market bubbles, moving from fundamental metrics to advanced algorithmic detection.
Before writing a single line of Python code or SQL, an analyst must understand the lifecycle of a bubble. We utilize the Hyman Minsky Financial Instability Hypothesis, which effectively maps quantitative data to five qualitative stages:
The Analyst’s Goal: To identify the transition from Boom to Euphoria using quantitative thresholds.
These metrics form the "bedrock" layer of your bubble detection dashboard. They are lagging but highly reliable for identifying when an asset class has detached from reality.
Unlike the standard P/E ratio, the Cyclically Adjusted Price-to-Earnings (CAPE) ratio divides the price by the average of ten years of earnings (adjusted for inflation).
This measures the total value of the stock market relative to the economy’s productivity.
Bubbles are fueled by leverage. When investors borrow money to buy appreciating assets, they create a feedback loop.
Markets are composed of humans. In the "Euphoria" phase, behavioral biases (FOMO, Herding) leave digital footprints.
Institutional investors rarely cause bubbles alone; they require retail liquidity to drive the "Euphoria" phase.
Using Natural Language Processing (NLP) to quantify the "This time is different" narrative.
Forecasting bubbles is not about predicting the exact day of a crash—that is a fool's errand. It is about identifying the conditions of instability.
As analysts, our job is to flag when the market has moved from a "High Growth" regime to a "Fragile" regime. By combining the fundamental gravity of the CAPE ratio, the physics-based predictions of the LPPLS model, and the behavioral insights of sentiment analysis, we can provide our firms with the most valuable asset of all: time to prepare.
International Institute of Business Analysis
· IIBA
BA Blocks
Industry Certification Programs:
CFA(Chartered Financial Analyst)
FRM(Financial Risk Manager)
CAIA(Chartered Alternative Investment Analyst)
CMT(Chartered Market Technician)
PRM(Professional Risk Manager)
CQF(Certificate in Quantitative Finance)
Canadian Securities Institute (CSI)
Quant University LLC
· MachineLearning & AI Risk Certificate Program
ProminentIndustry Software Provider Training:
· SimCorp
· Charles River’sEducational Services
Continuing Education Providers:
University of Toronto School of Continuing Studies
TorontoMetropolitan University - The Chang School of Continuing Education
HarvardUniversity Online Courses
Study of Art and its Markets:
Knowledge of Alternative Investment-Art
Disclaimer: This blog is for educational and informational purposes only and should not be construed as financial advice.